YOLO11n - NMS not working correctly - duplicate detections impacting mAP

I’ve come across this related issue and posted a comment, but it hasn’t had a response and since it referred to the C++ library, thought I’d open a new thread for the python library.

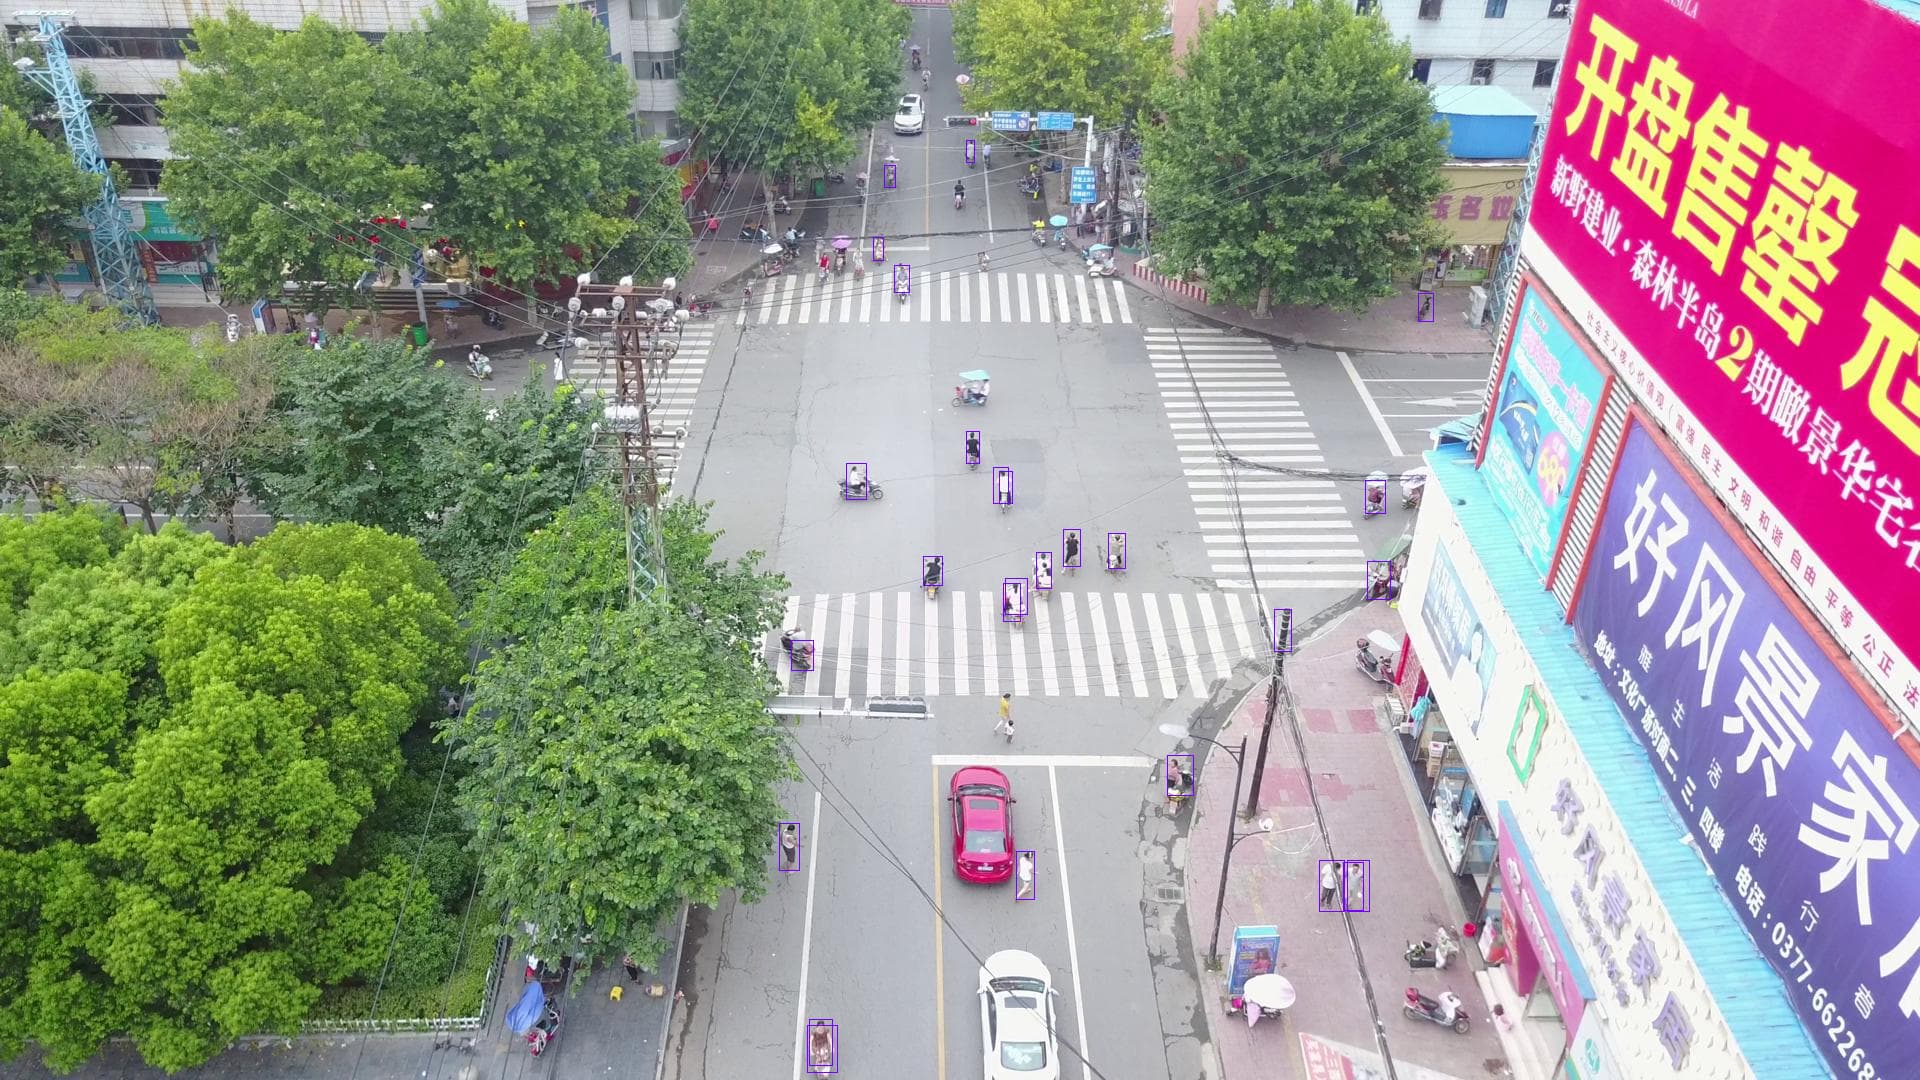
I’ve finetuned a yolo11n on VisDrone using Ultralytics - then used the DFC to parse and optimize the model to a model.har. I then run the inference with this model and seem to have a lot of overlapping detections.

Overall, these duplicates are shaving about 0.1 off the yolo11n.onnx mAP@50, so really need to fix it.
example issue here:

Parsing step:

runner = ClientRunner(hw_arch=chosen_hw_arch)
hn, npz = runner.translate_onnx_model(
    onnx_path,
    onnx_model_name,
    start_node_names=["/model.0/conv/Conv"],
    end_node_names=["/model.23/cv2.0/cv2.0.2/Conv", 
                   "/model.23/cv3.0/cv3.0.2/Conv",
                   "/model.23/cv2.1/cv2.1.2/Conv",
                   "/model.23/cv3.1/cv3.1.2/Conv",
                   "/model.23/cv2.2/cv2.2.2/Conv",
                   "/model.23/cv3.2/cv3.2.2/Conv"],
    net_input_shapes={"/model.0/conv/Conv": [1, 3, 640, 640]},
)

Optimise:

alls =  """
normalization1 = normalization([0.0, 0.0, 0.0], [255.0, 255.0, 255.0])
change_output_activation(conv54, sigmoid)
change_output_activation(conv65, sigmoid)
change_output_activation(conv80, sigmoid)
nms_postprocess("/local/shared_with_docker/visdrone/yolov11_nms_config_visdrone.json", meta_arch=yolov8, engine=cpu)

model_optimization_config(calibration, batch_size=16, calibset_size=256)
post_quantization_optimization(finetune, policy=enabled, learning_rate=0.00001, epochs=8, batch_size=16, dataset_size=3000)

allocator_param(width_splitter_defuse=disabled)
 """

runner.optimize(calib_dataset)

the JSON config is more or less unchanged from the repo - but updated for my class number. Do I need to update the nms_iou_th or nms_scores_th value?

Finally, I;ll run inference as:

        with runner.infer_context(InferenceContext.SDK_QUANTIZED) as ctx:
            output = runner.infer(ctx, input_data)

where the input_data is an np.array of images
This seems to be happening in all my yolo11n models, not getting any so far without these overlaps.

Any help whatsoever would be greatly appreciated

@natsayin_nahin
Can you clarify what you mean by 0.1 off the yolo11n.onnx mAP? What is the baseline?

Sure - basically my onnx models are hitting about 0.4 mAP@50, but the optimised (both FP32 and int8) .har models are losing 0.1 at least, with about 0.3 mAP@50, sometimes worse.

One thing I had a look at was adjusting the nms_config to include these - and that can pull it up to 0.38

{
    "nms_scores_th": 0.2,
    "nms_iou_th": 0.2,
    "image_dims": [
        640,
        640
    ],

However, should I really need to adjust the threshold to such an extreme. For example if you look at the detection in the bottom center, there is a huge amount of overlap, or the two people on the footpath on the right side; the boxes are quite clearly duplicates which I’ve thought a 0.7 threshold could handle

Hi @natsayin_nahin
Not sure how you obtained the original mAP but in general mAP eval is done with nms_score_th=0.01 and nms_iou_th=0.7 or nms_iou_th=0.6. However, real usage is done with nms_score_th=0.3 and nms_iou_th=0.6.
Still not sure why you are getting overlapping detections. If you can share your .hef file and example image, we can check using our PySDK if we can replicate this behavior.

Thanks @shashi , that would be greatly appreciated! Here are the files you requested plus some additionals (detailed list below).

Just for clarity - the results shown above are with the quantized .har model, not the .hef

Regarding the 0.4mAP, I exported the pretrained yolo11n.pt to yolo11n.onnx via ultralytics, then ran model.val() with the save_json=True so I’d get the json formatted detections. Taking the outputpredictions.json, I feed that into the COCOAPI (pycocotools) - this is where I got the 0.4 AP@50 value.

I’ve not taken my evaluation as far as the .hef for this model yet (though for previous experiements on this dataset, I’ve seen the .hef is actually another 0.05-0.1 worse in AP@50 vs. the .har model, so the .hef could well be in the 0.25 AP@50 range (I’ll come back and confirm if this soon).

In the linked folder there are the following files
Data files:

  • 0000001_03999_d_0000007.jpg - from VisDrone2019-DET valset
  • 0000001_03999_d_0000007.txt - a yolo formatted, modified (only two classes, (0) person + (1) pedestrian) gt file
  • annotations_VisDroneHumans_val.json - coco formatted annotations file for visdrone2019-det valset, again, only 2 classes
  • detections_yolo11n_visdrone_quant_optlvl2_ds3k_816_1e5_bestmodel.json - the quantized .har model detections in coco format

Models:

  • exp_1_yolo11n.onnx - file used for parsing to har
  • yolo11n_visdrone_exp1_hailo_model_op16.har - parsed model
  • yolo11n_visdrone_quant_optlvl2_ds3k_816_1e5_bestmodel.har - quantized model using default nms config
  • yolo11n_visdrone_quant_optlvl2_ds3k_816_1e5_bestmodel.hef - compiled model

thanks again, really appreciate any help on this!

Probably not needed, but as an fyi, the cocoAPI settings were more or less the defaults:

imgIds=sorted(cocoGt.getImgIds())
imgIds = imgIds[0:]
catIDs = [1,2]
useCats = 1
maxDets = [1, 10, 100]

# running evaluation
cocoEval = COCOeval(cocoGt,cocoDt,annType)
cocoEval.params.imgIds  = imgIds
cocoEval.params.catIds = catIDs
cocoEval.params.maxDets = maxDets
cocoEval.params.useCats = useCats

cocoEval.evaluate()
cocoEval.accumulate()
cocoEval.summarize()

Hi @natsayin_nahin
Thanks for sharing these assets. We will analyze and keep you posted but here are my initial observations:

Regarding the 0.4mAP, I exported the pretrained yolo11n.pt to yolo11n.onnx via ultralytics, then ran model.val() with the save_json=True so I’d get the json formatted detections. Taking the outputpredictions.json , I feed that into the COCOAPI (pycocotools) - this is where I got the 0.4 AP@50 value.

So, the default settings for model.val() is indeed very low nms_score_th(0.001).

We will take a closer look at overlapping detections but my guess is that the classes person and pedestrian are close enough to be confused and nms (based on settings) does not suppress boxes across classes (we will confirm if this is indeed the case).

Thanks for looking into it!

Interesting point which Id not considered, I’ll also take a look into that, though on a related note, I’ve also evaluated with COCOAPI param useCats=0 (i.e., ignore categories) and while it does indeed increase the overall mAP, there is still a decrease in mAP from onnx >> har >>hef, each step seems to drop about 0.1. Having useCats=0 doesn’t mean the issue you suggested isn’t still valid though, I’ll need to look into the script and see.

For the hef model I linked, I just ran it on the Pi, getting AP@50 of 0.211, looking at a single image, it too seems impacted by these detections.

PS as an FYI, looks like I wrongly used the name ‘yolo11s_visdrone’ when saving this quantized model, it is indeed a yolo11n however!

Running per image evaluation...
Evaluate annotation type *bbox*
DONE (t=6.86s).
Accumulating evaluation results...
DONE (t=0.19s).
 Average Precision  (AP) @[ IoU=0.50:0.95 | area=   all | maxDets=100 ] = 0.065
 Average Precision  (AP) @[ IoU=0.50      | area=   all | maxDets=100 ] = 0.211
 Average Precision  (AP) @[ IoU=0.75      | area=   all | maxDets=100 ] = 0.017
 Average Precision  (AP) @[ IoU=0.50:0.95 | area= small | maxDets=100 ] = 0.054
 Average Precision  (AP) @[ IoU=0.50:0.95 | area=medium | maxDets=100 ] = 0.150
 Average Precision  (AP) @[ IoU=0.50:0.95 | area= large | maxDets=100 ] = 0.125
 Average Recall     (AR) @[ IoU=0.50:0.95 | area=   all | maxDets=  1 ] = 0.020
 Average Recall     (AR) @[ IoU=0.50:0.95 | area=   all | maxDets= 10 ] = 0.084
 Average Recall     (AR) @[ IoU=0.50:0.95 | area=   all | maxDets=100 ] = 0.116
 Average Recall     (AR) @[ IoU=0.50:0.95 | area= small | maxDets=100 ] = 0.100
 Average Recall     (AR) @[ IoU=0.50:0.95 | area=medium | maxDets=100 ] = 0.232
 Average Recall     (AR) @[ IoU=0.50:0.95 | area= large | maxDets=100 ] = 0.167

getting AP@50 of 0.211 on the overall val dataset. When looking at a single image, it too seems impacted by these overlapping detections

(really wish there was an edit option!)

I’ve just noticed that with the model I uploaded, the overlaps aren’t as drastic in that image (though there are some). I’ve uploaded a couple more images which have some more overlaps.

Additionally, image 0000001_05999_d_0000011.jpg only has detections for one class, though still has some overlapping boxes. I’ve also taken that theory one step further and retrained the model using

ultralytics.model.train(..., single_cls=True, ...)

That argument ignores classes and just focuses on detections regardless of the class, everything gets mapped to classid=0 (pedestrian in yolo format). Thus for the PyCOCOTools, I can happily apply useCats=0 (ignore categories). This new evaluation comes out at 0.48 AP@50

Sadly, still a 0.1 drop on with optimized model.har, with 0.38 AP@50 on PyCOCOTools and still getting overlaps on the detections.

I’ve added these new single_cls onnx/har/hef files to the drive folder and moved them under a models subfolder

Hi @natsayin_nahin
We are taking a deeper look into this issue but so far we are unable to see overlapping detections you observed. We want to evaluate mAP using our own flow but for that we need the pytorch checkpoint file. Can you please provide it?

@shashi - thanks again for looking into it. I’ve uploaded two .pt files, exp_1_yolo11n.pt and exp_1_yolo11n_singlecls.pt, probably not needed but for good measure I’ve added the args yaml for the first (two class) model.

Both of these models were trained using Ultralytics

Thanks again!

Hi @natsayin_nahin
We finished our analysis using the 2 classes model. We compiled the model using our flow and ran a bunch of experiments and here are our observations:

  1. The mAP of the onnx floating point model with confidence_score_threshold=0.001 and nms_iou_threshold=0.7 is ~0.406
  2. The mAP of the onnx floating point model with confidence_score_threshold=0.2 and nms_iou_threshold=0.7 is ~0.31
  3. The mAP of the onnx floating point model with confidence_score_threshold=0.001 and nms_iou_threshold=0.6 is ~0.41
  4. The mAP of the onnx floating point model with confidence_score_threshold=0.2 and nms_iou_threshold=0.6 is ~0.312

As you can see, the confidence_score_threshold makes a lot of difference.

We compiled the onnx to .hefand evaluated the model. Note that we did not do any finetuning.

  1. The mAP of the hef model with confidence_score_threshold=0.001 and nms_iou_threshold=0.7 is ~0.381
  2. The mAP of the hef model with confidence_score_threshold=0.2 and nms_iou_threshold=0.7 is ~0.267
  3. The mAP of the hef model with confidence_score_threshold=0.001 and nms_iou_threshold=0.6 is ~0.389
  4. The mAP of the hef model with confidence_score_threshold=0.2 and nms_iou_threshold=0.6 is ~0.267

Furthermore, there does not seem to be anything wrong with the nms logic. The overlapping boxes indeed have iou<0.7. You can decrease nms_iou_threshold to 0.6 and get better mAP and better results (depending on confidence_score_threshold).

To summarize, the mAP loss at confidence_score_threshold=0.001 is around 0.02 and 0.43 at confidence_score_threshold=0.2. Overall, not as degraded as what you saw. We believe that if you evaluate mAP with lower confdence threshold, you will observe similar results. For confidence threshold of 0.2, we are not sure why your numbers are so low. We can share our compiled version and you can check.

1 Like

hi @shashi - thanks a lot for taking the time to validate. I also adapted the nms file and obtained similar results to what you mention, though only for yolov11 and not quite as good as 0/38 (I get 36 with fine tuning). These are acceptable for the use case, though if you are able to share the models it would be perfect, but no problem if unable.

Hi @natsayin_nahin
I will ask my team to share the models with you.