Install FlameGraph
sudo apt install -y linux-tools-$(uname -r) linux-tools-common
git clone https://github.com/brendangregg/FlameGraph
Compile YOUR-APP with -g and -O0 flags, then you can execute like below:
sudo time perf record -g -o perf_with_stack.data YOUR-APP
sudo perf script -f -i perf_with_stack.data | FlameGraph/stackcollapse-perf.pl | FlameGraph/flamegraph.pl > flamegraph.svg
The result is a an SVG that can be viewed on a web browser-
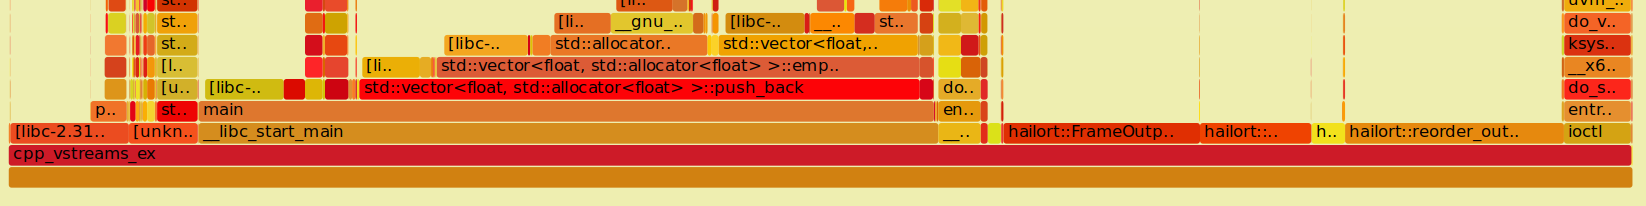
From this graph you can see which call-graph was taking the majority of the execution time. The x-axis is the time, so longer boxes means longer execution time on the CPU.