LTTng (Linux Trace Toolkit: next generation) is a system software package for correlated tracing of the Linux kernel, applications and libraries.
LTTng uses the Tracepoint instrumentation of the Linux kernel, as well as various other information sources such as kprobes, and the Perf performance monitoring counters.
Designed for minimal performance impact and having a near-zero impact when not tracing, it is useful for debugging a wide range of bugs that are otherwise extremely challenging.
Here are the steps to apply LTTng to the tracing of Hailo inference code written in C++.
- Follow the documentation to install LTTng:
 LTTng v2.13 — LTTng Documentation — LTTng
If the installation is on Ubuntu 22.04, and if you got any error related to kernel 6.2 or 6.5 installation, please install the stable ppa version: LTTng v2.13 — LTTng Documentation — LTTng - Verify that the library liblttng-ust.so is in the expected path /usr/local/lib . If not, they may be in /usr/lib/x86_64-linux-gnu and you will have to add this path to the environment variable
LD_LIBRARY_PATH - Install Trace Compass as trace visualizer:
 Trace Compass . After installation (basically uncompressing the tar.gz), try to run it by double-clicking on tracecompass icon and if you get an error related to incompatible Java JM version, please upgrade your Java Open JDK to OpenJDK 17 by following these instructions:
  How to Install Java on Ubuntu 22.04 | Step-by-Step Tutorial
 - To illustrate how to modify CPP application code to include tracing code, we are going to use the following yolov8 post estimation as example: Hailo-Application-Code-Examples/runtime/cpp/pose_estimation/yolov8_pose at main · hailo-ai/Hailo-Application-Code-Examples
a) After cloning the repo, copy the attached files tp.c and tp.h in the directory …/Hailo-Application-Code-Examples/runtime/cpp/pose_estimation/yolov8_pose/ . These files define the tracepoint functions that the application will call. We are defining 3 functions to trace 3 different types of events:
i. write event: when a new buffer is submitting to the input stream for inference
ii. read event: when a processed buffer is obtained from the output vstream
iii. control event: to alert when Hailo is initialized and released
b) Modify the application code by calling the tracepoint functions at desired locations.
You’ll also need to insert a line that prompts the user to press a key:
// Code to ask to press a key to continue
std::cout << BOLDBLUE << “-I- Press any key to continue” << RESET << std::endl;
std::cin.get();
Please see the attached file yolov8pose_example.cpp as example.
c) Modify the CMakeLists.txt by adding ./*o to the statement file(GLOB SOURCES
And after link_libraries(stdc++fs), add these 2 lines:
link_libraries(lttng-ust)
link_libraries(dl)
Please see attached example file CMAkeLists.txt.
- Compile first the tracepoint files into a *.o file:
gcc -c -I. tp.c - Build your application:
./build.sh
If you are getting any linking error, verify yourLD_LIBRARY_PATHvariable has the path to the liblttng-ust.so library (/usr/local/lib or /usr/lib/x86_64-linux-gnu). - Run the application:
./build/x86_64/vstream_yolov8pose_example_cpp -hef=yolov8s_pose.hef -input=zidane.jpg -num=1000
It will halt and ask you to press a key. - Open a separate terminal window and run:
a)lttng-sessiond --daemonize
b)lttng create my-user-space-session
Pay attention to the message showing the directory name where the traces will be dumped
Ex: Traces will be output to /home/victorc/lttng-traces/my-user-space-session-20240813-233621
c)lttng enable-event --userspace hailo_yolov8_pose:control;lttng enable-event --userspace hailo_yolov8_pose:read;lttng enable-event --userspace hailo_yolov8_pose:write
d)lttng start - Back to the other terminal window where your application is waiting for you keystroke, press a key to resume the application and the inference until completion.
- Go back the terminal window where you executed ‘lttng start’ and run:
lttng destroy - For visualization of the traces that were dumped in the trace directory, follow these instructions:
a) Launch Trace Compass
b) Select menu File->Open Trace
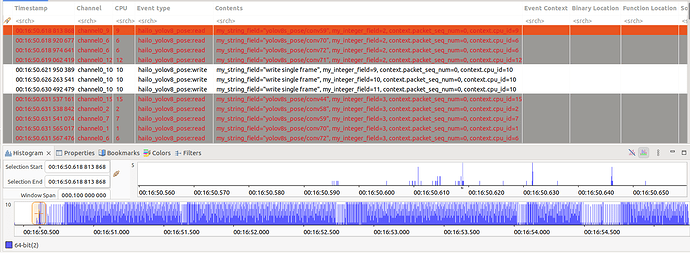
c) Navigate to the directory where the traces were dumped. Go all the way down to the subdirectories containing the trace files 'channel’* and select any file. The software will load all the files in the directory and display the trace graph.
d) Refer to the following doc to filter the events: Trace Compass User Guide - Trace Compass Main Features.
e) Use the Colors menu to assign a color to a particular event. Use right-click to define the filter for the color as shown below:


