I have recently been running the Tappas GStreamer pipeline, and I wanted to add debugging. To do this, I used GstShark, but I noticed that I get weird values for the CPU usage in my graph.
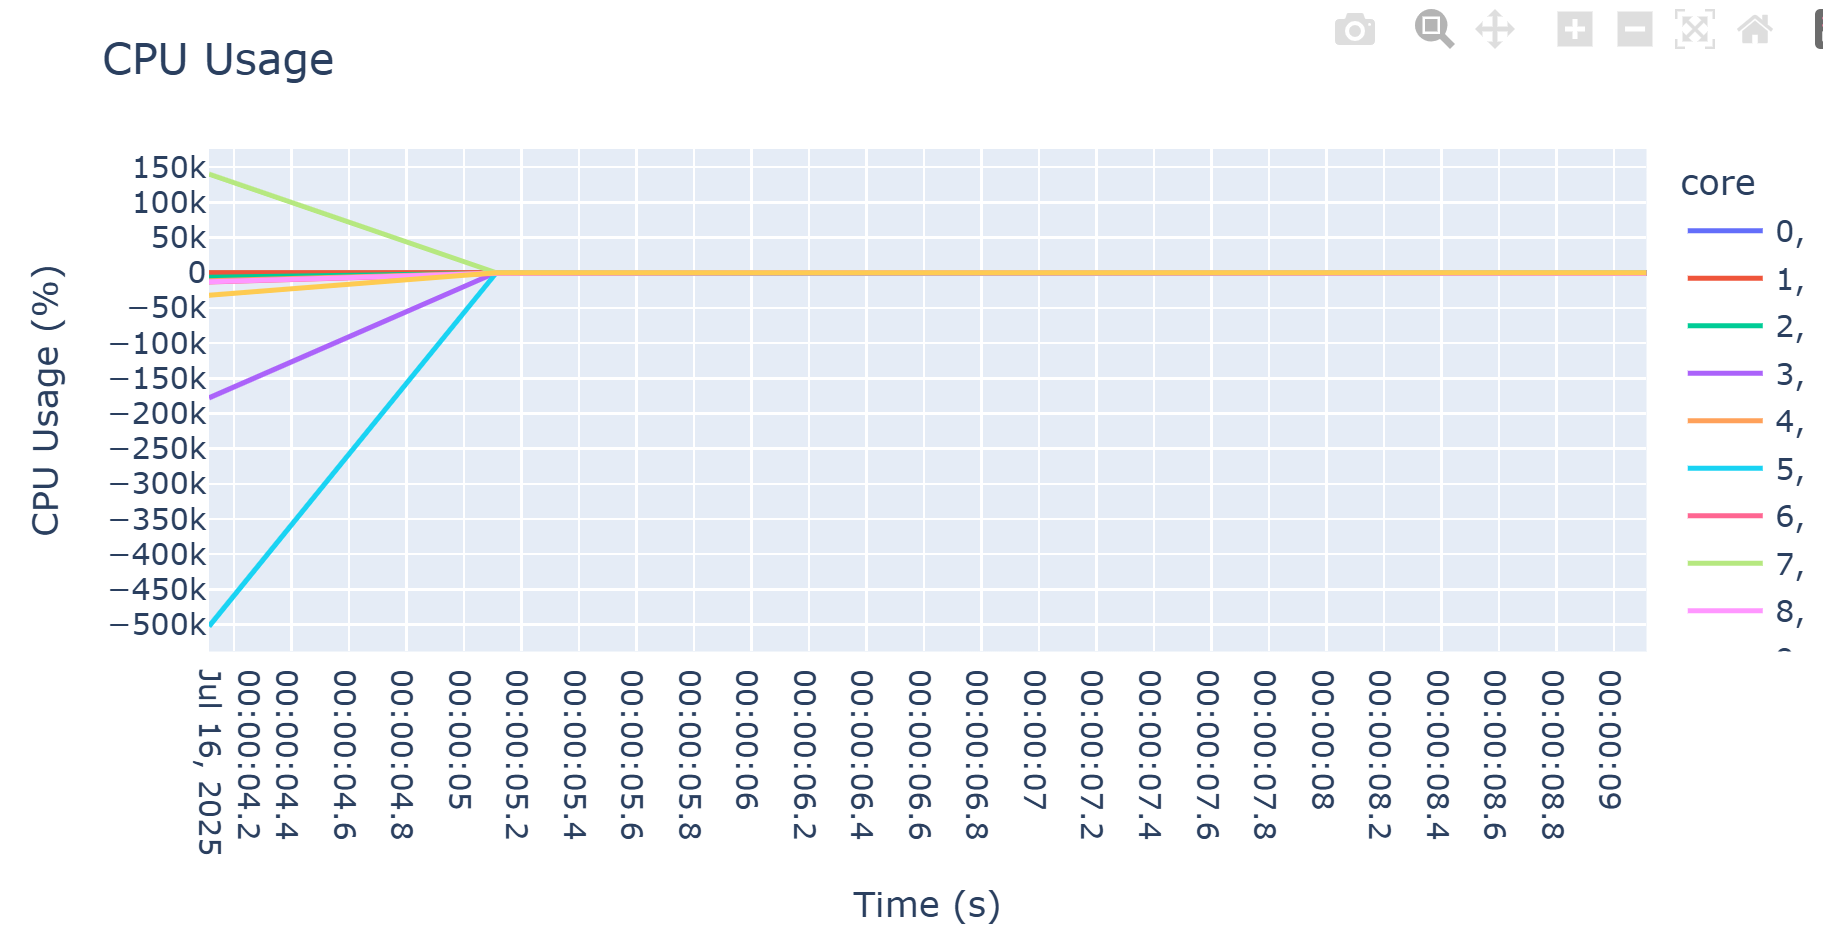
The issue is that our plotting logic treats any tracer emitting load=… fields as CPU usage data. The threadmonitor tracer reports raw CPU-time deltas in microseconds, not percentages, but these get plotted on the same “CPU Usage” axes as the actual percentage values from cpuusage. Those massive spikes and negative values you’re seeing are just thread CPU-time readings being misinterpreted as percentage data.
This was actually reported upstream in the gst-shark tracker (Issue #99) - Ubuntu users were seeing similar negative “CPU usage” values due to delta calculation quirks in the raw timing data.