I’m running a YOLOv8s model on a Hailo-8, and I would like to understand what the real peak usage is while running the model. Is there a way to measure that accurately?
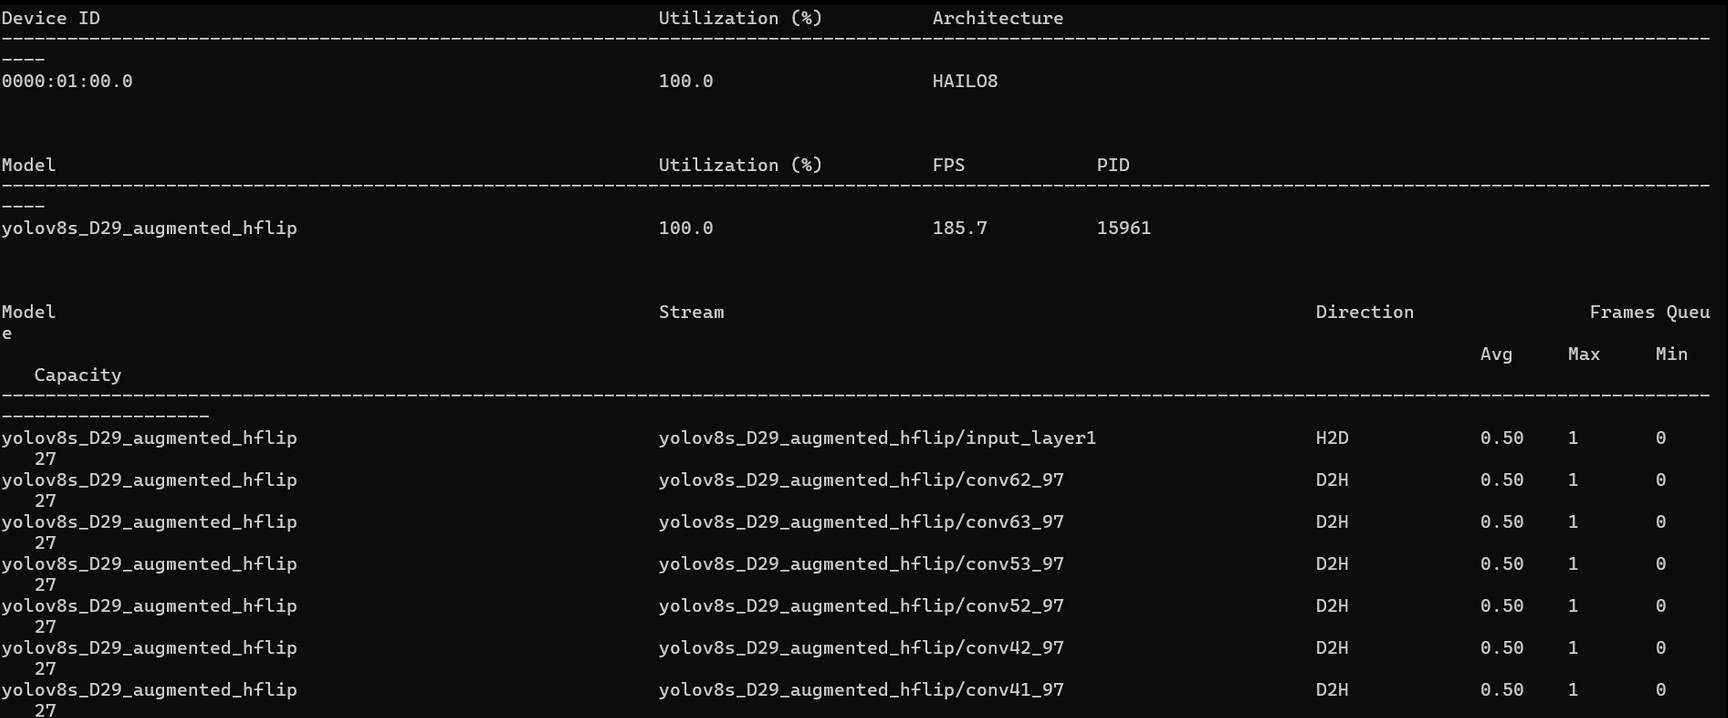
I ran hailortcli monitor and got the attached information showing 100% utilization, but from my understanding, 100% utilization does not necessarily mean that the model is using 100% of the Hailo-8 TOPS. It means the accelerator is fully occupied/running the workload, but it does not directly tell how many TOPS are being used.
Could you clarify how this utilization value is calculated and whether there is a more accurate way to measure the real peak usage or workload of the accelerator while running inference?
You’re correct that the 100% utilization shown in hailortcli monitor reflects the scheduler’s runtime occupancy - meaning the device is continuously busy processing your workload - but it doesn’t directly tell you how many of the 26 TOPS are actually being exercised by your model’s computations.
To get a clearer picture, you might try using the Hailo Profiler tool (available in the Dataflow Compiler / AI Software Suite), which reports GOPs per frame for your compiled model; multiplying that value by your measured FPS should give you an approximation of the actual TOPS being consumed during inference.
The profiler also breaks down internal resource utilization (MAC utilization, sub-cluster usage, memory bandwidth, etc.) which can help you understand how efficiently your YOLOv8s mapping uses the hardware.
Thanks for the info, I got the number. It’s interesting because I’m running at 30 FPS, so my TOPS utilization is around 0.8, which is very low, and theoretically I could be using the Hailo-8L. However, when I tried the Hailo-8L, the frame rate became an issue. I got less than 25 FPS, and I also noticed a degradation in the model accuracy. Does this make sense?