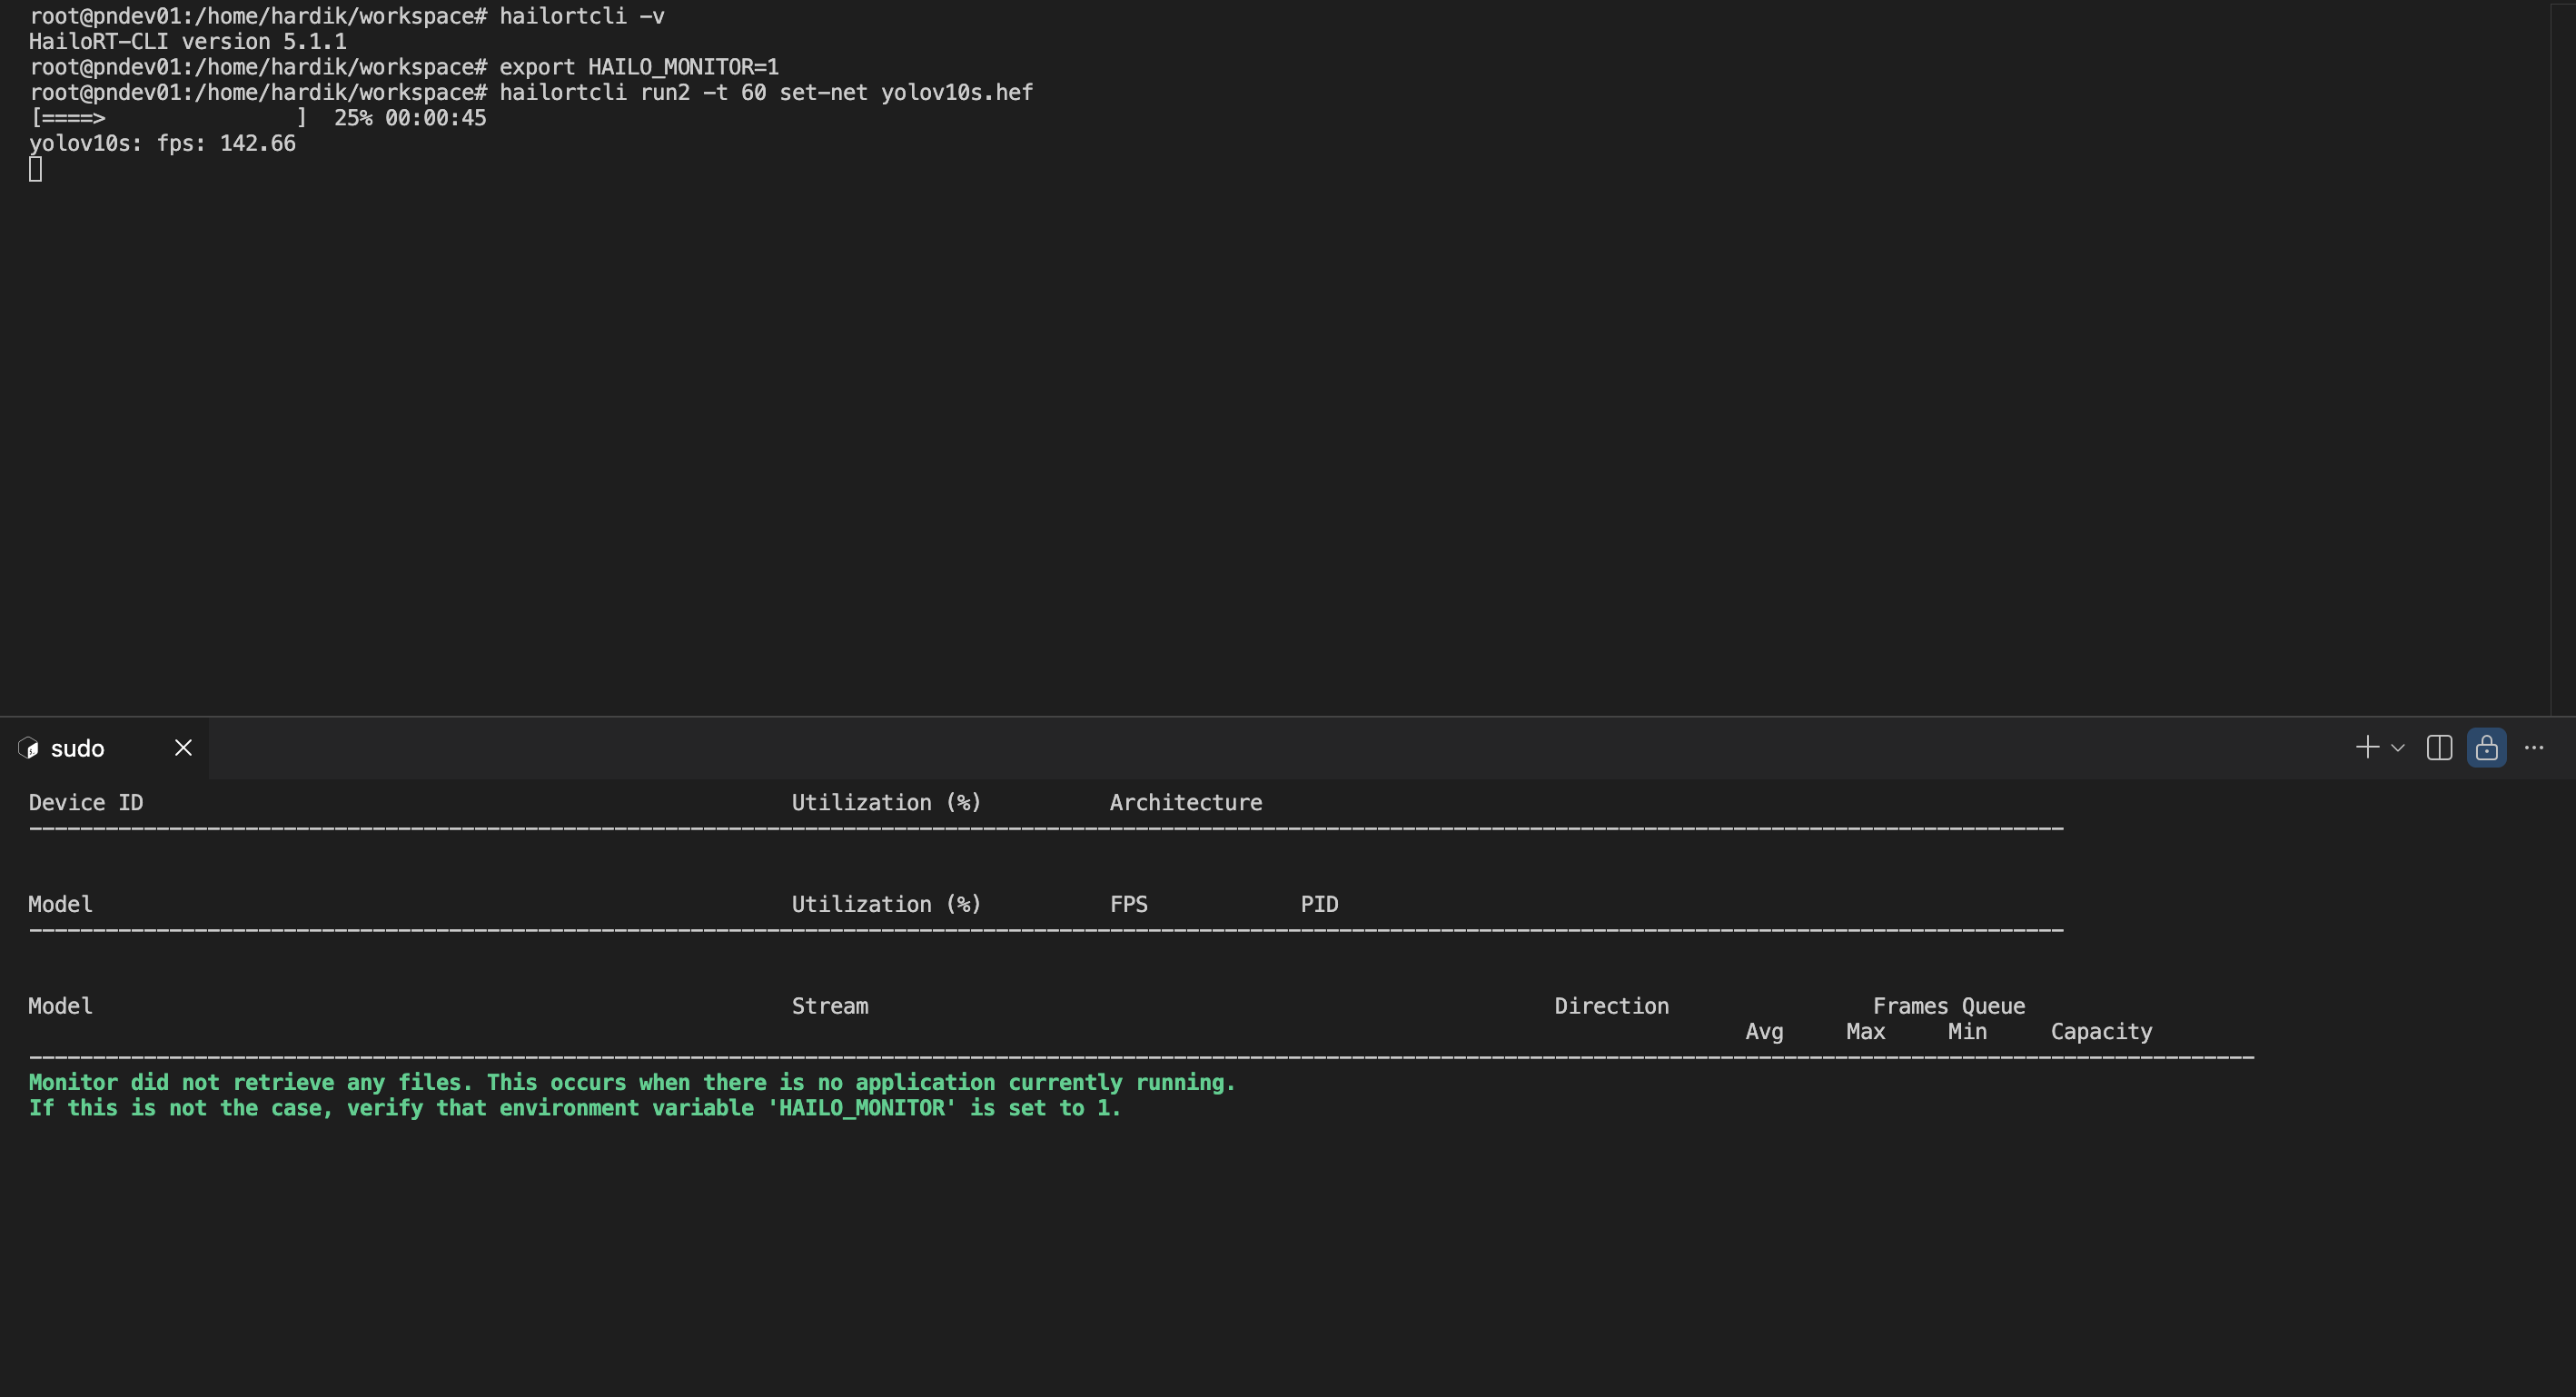
I am trying to get the utilisation of theHAILO device using hailortcli monitor. I have checked the other similar threads, and according to them, setting HAILO_MONITOR=1should make it work.
As shown in the screenshot, in one terminal, I am setting the HAILO_MONITOR env and running the model. But don’t see anything in the 2nd terminal.
**HAILORT version: 5.1.1
**
Furthermore, I have noticed that in HAILORT 5.1.1 deb package, hailort.service is not installed. I have worked with Hailo-8 and older HailoRT versions (<=4.23). There, the hailort service was present. Is that not part of the deb package anymore?
Re HailoRT Monitor: It’s not supported yet for Hailo-10H. We are aware and working to solve it in one of the next software versions.
Re service: It’s not needed for Hailo-10H. Multiple processes can use the device concurrently working directly with the kernel driver, without the service.
I saw your previous answer regarding the hailortcli monitor command not being supported for Hailo-10H on HailoRT 5.1.1.
I am currently using HailoRT 5.2.0 with Hailo-10H. Could you please confirm if the hailortcli monitor functionality is supported for Hailo-10H in this version?
I have performed extensive troubleshooting, but I am still unable to retrieve any information with the monitor. If it is still not supported in this version, could you please provide an estimated timeframe or a rough idea of when it might become available in a future software release?
Regarding your question about the workload I’m trying to run/troubleshoot:
I am currently running AI models on a Hailo-10H device, which is connected via PCIe to a TI J784S4 EVM(Linux Base System). My HailoRT version is 5.2.0.
My primary goal is to measure the utilization of the Hailo-10H device’s CPU, NPU, and RAM while my AI models are executing. This is crucial for performance analysis and optimization.
Since hailortcli monitor is not an option yet, I’m wondering if there are any alternative methods or tools available (either from Hailo or third-party) that I can use to monitor these metrics (CPU, NPU, RAM utilization) for Hailo-10H on HailoRT 5.2.0?
Running into the same issues - primary use case is to be able to measure the amount of RAM. ( but other stats as well )
Is there any method to access those stats on the Hailo-10H hat? I don’t necessarily need a fully fleshed out monitor – just some way to emulate a /proc/meminfo style interface.
Feature request: Expose Hailo-10H DRAM utilization via HailoRT API or sysf
Feature Request
Device: Hailo-10H (hailo1x_pci driver, HailoRT 5.1.1) Platform: Raspberry Pi 5, Linux 6.12
Summary
There is currently no way to query DRAM memory utilization on the Hailo-10H from
userspace. This makes it impossible to monitor how much of the 8GB LPDDR5X is
in use for loaded network groups, buffers, or firmware state.
HAILO_MONITOR=1 / /tmp/hmon_files/ — not supported on Hailo-10H (Hailo-8/8L only)
PCIe BAR register scan (BAR0/2/4) — live counters found appear to be DMA transfer
counters, not memory utilization; no register with values consistent with GB-scale
memory accounting was found
Request
Please expose DRAM utilization (used/total bytes) via one or more of:
A new hailo_device_properties field or dedicated ioctl
A sysfs attribute under /sys/bus/pci/devices/.../hailo_chardev/hailo0/
A hailortcli subcommand
Extension of the HailoRT Python/C API
This would enable system monitoring dashboards and resource management tooling
for production deployments.
Over development team replied that it’s possible to query the DRAM utilization, as well as some other stats, using the query_performance_stats API, please see here for details:
We will look into the option to add it to hailotcli as well to make it even more accessible and easier to use.
Awesome thanks will check that out… secondary note I am seeing some tendency to segfault when HAILO_MONITOR=1 is called and two devices try to hit the PCI – I fully lose access to the PCI and have to reboot, NBD as this is lab not prod – appreciate all the work. Thank you!
I gave it a shot - some progress – but keep getting a baseline value - not looking like true memory utilization findings on query_performance_stats below:
Following up after testing query_performance_stats() and query_health_stats() on a Hailo-10H (M.2 HAT, Raspberry Pi 5, HailoRT 5.1.1):
What works:
on_die_temperature, on_die_voltage, bist_failure_mask from query_health_stats() — all return accurate values
cpu_utilization from query_performance_stats() — returns global Hailo SoC CPU load (~5–10% during inference), useful as a health indicator
What doesn’t work as expected:
ram_size_total / ram_size_used — these track only the SoC firmware’s OS heap (~6 MB total, ~120–130 KB used). Model weights and inference buffers are DMA-mapped directly into hardware memory and are invisible to this counter. Loading a 3.68
MB HEF and running 50 inference frames caused only a 6.6 KB increase in ram_size_used. This does not *seem to be a utilization metric from this test.
nnc_utilization — always 0 when queried from an external monitoring process. This appears to be a per-session metric reflecting only NNC activity from the same Device handle, not a global counter.
dsp_utilization — returns -1 (not available on this configuration)
Note on Python bindings: query_performance_stats() and query_health_stats() do not seem to be exposed in the hailo_platform Python bindings (v5.1.1). We called them via a small C++ helper binary linking directly against libhailort.so. Also worth noting:
VDevice.configure() + InferVStreams returns HAILO_NOT_IMPLEMENTED on Hailo-10H … should the InferModel API should be used instead?
Happy to share the test script if useful. Thanks again for your response! Appreciate this amazing tool and community.
I am seeing some tendency to segfault when HAILO_MONITOR=1 is called and two devices try to hit the PCI – I fully lose access to the PCI and have to reboot
I am not sure I follow, do you mean two physical Hailo-10H devices? Or you use the same device from two different processes? Does it also happen without the HAILO_MONITOR env var? (Which is anyway not supported for now for Hailo-10H)
Following up after testing query_performance_stats() and query_health_stats() on a Hailo-10H (M.2 HAT, Raspberry Pi 5, HailoRT 5.1.1):
Thanks for the detailed feedback, we will look into it.
Note on Python bindings: query_performance_stats() and query_health_stats() do not seem to be exposed in the hailo_platform Python bindings (v5.1.1).
We will look into closing this gap in the Python API.
I’ve read your test results for query_performance_stats() and query_health_stats() on the Hailo-10H with great interest. Your observations, especially regarding RAM usage and nnc_utilization, are very valuable for future development.
If it’s not too much trouble, would you be willing to share the script you used for your tests? It would be extremely helpful for reproducing the detailed behavior and conducting further investigation.
Thanks for following up and closing the gap – yes I was unclear on “two devices” – I meant two “processes” or two “programs” – was trying to be imprecise and got confusing… the “its not supported on 10H” makes sense. Following on – and if you try it, bad things can happen. Only anecdotal, I have not tested or debugged exactly why.
Hi @KristofferSingleton, please note that many of the feedback points discussed in this thread have been addressed in HailoRT v5.3.0, which we just released. This includes:
hailortcli monitor support for Hailo-10H
Bug fixes in query_performance_stats()
Python binding for query_performance_stats()
You’re welcome to try it out, and let me know if you have any additional feedback.