Hey, I’m wondering about your FPS in benchmarks you give. For example, it is 181 for yolov8n for batch size 1. Please tell me how you have performed so well and how I can achieve it. And is it possible to have the same performance on the model retrained on the custom dataset? Thank you!!!
Yes, of course it’s possible. You should download the compiled network (HEF file) to the target system and use the CLI tool to run it:
hailortcli run <file.hef>
Please note that it’s important to test the network out-of-context. Meaning that any other system bottleneck is removed (e.g. video decoding, post-processing, database access etc.). This would give you the uppper limit where it comes to the NNcore engine. After that, when you plug it into a reallife scenario, you should strive to meet that number, albeit, in reality it is hard to get to it 100%.
@Nadav, thank you for the answer; run it on your standard yolov8n from here and get it. What is wrong?
In general, some of the benchmarks in the general page would be higher than when ran on the pi, since the pi has only one PCIe lane.
Specifically, your numbers seems very low. Have you enabled Gen3 on the pi?
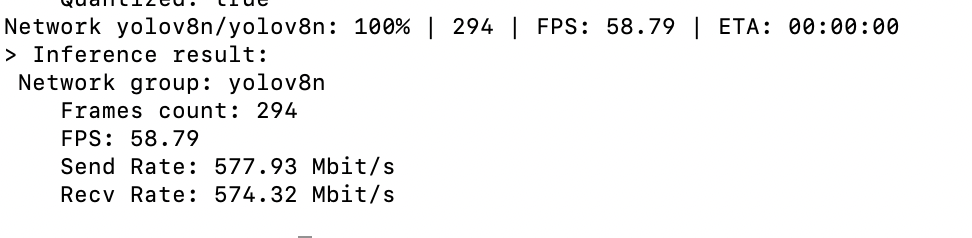
When I run I get almost twice the FPS:
@Nadav It was enabled. Try to make it disabled, and allow it once more time and have the results you have; thank you. Maybe it is required to reconfigure it every time the software for PCIe is updated
Hello
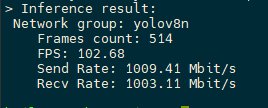
When I run yolov8n, I get 2x the FPS as in the picture, is it normal?
Hey @suk,
Welcome to the Hailo Community!
You’re getting very close to achieving the FPS we typically see. To further optimize it, you might want to try compiling it in performance mode for even better results.
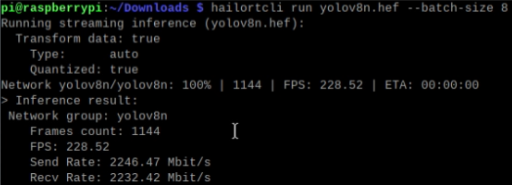
Hi @suk, in addition to what @omria mentioned, please note that batch size impacts the performance of models with multiple contexts. You are using batch size 8, which explains the higher FPS.
Hey, I have custom trained yolov8m. I am working with imx8 plus board with hailo 8. But when i run above command to check FPS it is showing 22 FPS only. How Can I optimize it ?
Hey @Suraj_Upadhyay,
Welcome to the Hailo Community!
Is this a custom model or one you downloaded from the Model Zoo? If it’s a custom one, you’ll want to make sure you’re running in performance mode during compilation - that should give you much better FPS.
Also, how are you handling the inference? That could be another factor affecting your frame rate.
Let me know!
Hey @omria ,
I just ran :
hailortcli run yolov8m.hef
command to check the FPS on my setup which is iMX-8 plus with Hailo 8 and single camera. My model is custom model which I have trained myself. It is yolov8m. As my use case is a real time system
- I don’t think there will be any use of using batch size. As per my understanding if I use let’s say batch size of 4 during inference Hailo will wait for camera to give it 4 frames and then it will take those 4 frames and will run inference. Means batch size is use full when in same setup 4 cameras are attached so that Hailo can run inference on all 4 frames together.
- regarding your question of compilation I have kept performance disabled as my accuracy drops a lot when I enable it.
Hey @Suraj_Upadhyay,
Performance mode shouldn’t impact accuracy significantly when configured conservatively. I’d suggest recompiling the model using these optimized flags:
Recommended Compilation Configuration (all.yaml)
parser:
  convert_relu_to_lrelu: true
  optimize_padding: true
  shave_quantization: true
  merge_batch_norm: true
quantization:
  calibrate:
    full_image: true
    iterations: 50
compiler:
  performance_mode: latency
  performance_optimization_level: default
  optimize_operators: true
  memory_view: compact
This configuration should improve your FPS while maintaining accuracy levels very close to the original model.
Hey @omria ,
Thankyou for detailed personalized answer. Actually till now i was compiling using this command :
hailomz compile --ckpt= --hw-arch hailo8 --calib-path --classes --performance
I could not find above suggested flags by you anywhere not even in python notebook tutorial for DFC. Can you please guide me how to use above flags while compilation ?
Here is the MZ Documentation :
hailomz parse <model_name>
hailomz parse <model_name> --hw-arch hailo8
hailomz parse <model_name> --start-node-names <name1> --end-node-names <name2>
Optimization (pg. 17–18)
hailomz optimize <model_name>
hailomz optimize <model_name> --har /path/to/model.har
hailomz optimize <model_name> --calib-path /path/to/calib/images
hailomz optimize <model_name> --performance
hailomz optimize <model_name> --input-conversion nv12_to_rgb
hailomz optimize <model_name> --resize 1080 1920
hailomz optimize <model_name> --classes 80
Compilation (pg. 18–19)
hailomz compile <model_name>
hailomz compile <model_name> --hw-arch hailo15h
hailomz compile <model_name> --har /path/to/model.har
hailomz compile <model_name> --input-conversion nv12_to_rgb
hailomz compile <model_name> --resize 1080 1920
Evaluation (pg. 19–20)
hailomz eval <model_name>
hailomz eval <model_name> --har /path/to/model.har
hailomz eval <model_name> --target emulator
hailomz eval <model_name> --target hardware
hailomz eval <model_name> --target <device_id>
hailomz eval <model_name> --data-count <num-images>
hailomz eval <model_name> --input-conversion nv12_to_rgb
hailomz eval <model_name> --resize 1080 1920
hailomz eval <model_name> --visualize
hailomz eval <model_name> --visualize --video-outpath /path/to/output.mp4
![]() So the flags you were looking for (
So the flags you were looking for (--hw-arch, --har, --performance, --resize, --input-conversion, --classes, --calib-path) are officially documented — but some belong to optimize while others belong to compile.
I am currently testing the Hailo8 chip, and the “hailortcli run” command is returning some strange results. The models were downloaded from Hailo Model Zoo. Raspberry Pi 5 platform, PCi Gen3 enabled. And the yolo11s model is far from the claimed results.
Running streaming inference (yolov11s_1.hef):
  Transform data: true
    Type:      auto
    Quantized: true
Network yolov11s/yolov11s: 100% | 121 | FPS: 24.19 | ETA: 00:00:00
> Inference result:
 Network group: yolov11s
    Frames count: 121
    FPS: 24.19
    Send Rate: 237.84 Mbit/s
    Recv Rate: 236.35 Mbit/s
At the same time, the yolov8s model produces much better results, radically better. Although, according to Ultralitics, the yolo11 model should be more productive and lighter than yolo8.
Running streaming inference (yolov8s_1.hef):
  Transform data: true
    Type:      auto
    Quantized: true
Network yolov8s/yolov8s: 100% | 993 | FPS: 198.36 | ETA: 00:00:00
> Inference result:
 Network group: yolov8s
    Frames count: 993
    FPS: 198.36
    Send Rate: 1949.96 Mbit/s
    Recv Rate: 1937.77 Mbit/s
Why is there such a difference, and why are my results so much worse than the stated ones? And what are these astronomical values in the Hailo8 benchmark results table for the yolov8s and yolov8n models?
I found the reason for the low performance: my Hailo chip is connected via a bridge, which reduces the speed to gen2. But even for gen2, my performance is still very low.
I also understood why the yolov8s and yolov8n models have such crazy speeds, because they fit into one context.
@omria Why then does yolo11s, which is simpler in structure, not fit into one context? Is your compiler not optimized to work with this version of the model?
Hello Omria, do we need to call nv12 to rgb in both optimize and compile or we can call it in compile only so calibration is made with rgb dataset and nv12 to rgb is done in production only? In case we use it in compile only do we need to call normalization1 = normalization([0.0, 0.0, 0.0], [255.0, 255.0, 255.0]) in optimize alls?